PITWALL
F1-TelemetryStation-Pro
F1 data analysis
What is this?
F1-TelemetryStation-Pro is an open-source F1 data analysis and telemetry visualization tool.
It allows race engineers, sim racers, and data fans to analyze lap times, throttle usage, speed traces, and driver comparisons using real Formula 1 telemetry.
A professional Formula 1 telemetry analysis workstation providing comprehensive race data analysis capabilities.
🌟 Features Overview
Core Analysis Modules
🌧️ Rain Analysis Module
Analyzes meteorological conditions throughout the race
- Temperature variation per lap
- Rainfall tracking and trends
- Weather impact on race strategy
🏁 Lap Analysis Module
In-depth single-lap performance analysis
- Driver lap time comparison
- Fastest lap analysis
- Comprehensive telemetry data

Sub-modules:
- ⚡ Speed Analysis - Velocity tracking and comparison
- 🛑 Brake Analysis - Braking pressure and points
- ⚡ Throttle Analysis - Accelerator pedal position
- ⚙️ Gear Analysis - Gear shifting patterns
- 🔄 RPM Analysis - Engine speed monitoring
- 📈 Acceleration - G-force analysis
- 📊 Speed Differential - Speed difference tracking
- 📏 Distance Differential - Cumulative distance gap
🚀 Throttle Analysis Module
Comprehensive throttle usage analysis and comparison
Throttle Line Chart:
- Dual-driver comparison: Compare throttle usage patterns between two drivers
- Per-lap percentage: Visualize full throttle usage percentage for each lap
- Interactive tooltips: Draggable tooltips with detailed lap information
- System settings integration: Customize display preferences
- Driver 2 optimization: Optional second driver selection (defaults to None)
Throttle Box Plot:
- Statistical distribution: Box plot visualization of throttle usage across all drivers
- Percentage modes: Toggle between actual percentage or lap percentage display
- Min/Max tooltips: Hover to see extreme values and outliers
- Multi-driver comparison: Analyze throttle patterns for entire grid
- Team color coding: Visual identification by team colors
Key Features:
- 📊 Lap-by-lap throttle usage tracking
- 🎯 Dual-driver comparison with independent selection
- 🖱️ Draggable legend and pinnable data points
- 📈 Real-time data point tooltips with drag support
- ⚙️ Configurable through System Settings dialog
- 🎨 Team-based color schemes
🏎️ Pitstop Analysis Module
Strategic pitstop efficiency evaluation
- Pitstop duration statistics
- Stop frequency comparison
- Team efficiency metrics
🗺️ Track Analysis Module
Interactive track visualization
- Circuit trajectory display
- Driver position markers
- Zoom and pan support
🚗 Detailed Lap Analysis
Advanced lap time data analysis
- Detailed lap time tables
- Box plot visualizations
- Statistical distribution analysis
🔥 Accident Analysis Module
Race incident investigation
- Incident timestamps
- Involved drivers
- Impact assessment
🏁 Tire Strategy Analysis
Tire usage and strategy evaluation
- Compound selection analysis
- Degradation curves
- Pit stop timing optimization
📊 Ideal Lap Analysis Module (NEW in V0.3.0)
Comprehensive theoretical best lap analysis and sector comparison
Ideal Lap Ranking Table:
- Complete Grid Analysis: Theoretical best lap times for all drivers
- Statistical Metrics: Median, range, and gap calculations
- Team Color Coding: Visual driver identification with standardized colors
- Session Summary: Fastest laps and perfect lap achievement rates
- Sector Breakdown: Individual sector performance with visual indicators (✓ = optimal, ✗ = improvable)
- API Integration: Real-time data from F1T API
Ideal Lap Sector Comparison:
- Sector-by-Sector Analysis: Detailed S1, S2, S3 delta comparison
- Cumulative Delta Visualization: Bar chart showing total improvement potential
- Sortable Columns: Click to sort by any sector or cumulative delta
- Color-Coded Performance: Unified color standards for gap displays

UI Refinements (October 10, 2025):
- ✅ Sector marks with color separation (green ✓, black ✗)
- ✅ Unified color standards for all gap displays (0.2s, 0.5s thresholds)
- ✅ Sortable cumulative delta in sector comparison table

🌳 Interactive Lap Analysis Tree (NEW in V0.3.0)
Hierarchical lap data visualization with intelligent filtering
- Tree Structure: Organize laps by driver with expandable nodes
- Smart Filters: Exclude pit laps, safety car periods, and statistical outliers
- Statistical Summaries: Per-driver lap count, median time, and lap range
- Click-to-Analyze: Double-click any lap to view detailed telemetry analysis
- Visual Indicators: Color-coded lap times showing fastest/slowest laps
- Responsive Design: Auto-resizing columns with optimal width distribution

🔗 Special Features
Linkage System
- X-axis Synchronization: Multiple telemetry charts display the same position
- Click Linkage: Click on one chart, others follow automatically
- Master Toggle: Global enable/disable for linkage functionality
Workspace Management
- Save Workspace: Preserve current analysis configuration
- Load Workspace: Quickly restore previous analysis environment
- Multi-tab Support: Open multiple analysis perspectives simultaneously
MDI Window System
- Free Arrangement: Drag and resize windows freely
- Cascade/Tile: Quick window layout organization
- Pop-out Feature: Display analysis windows independently
Enhanced Chart Interactions (NEW in V0.2.0)
- Draggable Tooltips: Pin and drag tooltip boxes to any position
- Data Point Pinning: Click to pin data points with persistent tooltips
- Connection Lines: Dashed lines connecting tooltips to original data points
- Dual-driver Tooltip Separation: Independent tooltips for each driver’s data
- Draggable Legend: Reposition chart legends for better visibility
🌐 System Highlights
- Multi-language Support: 中文 🇹🇼 / English 🇺🇸 / 日本語 🇯🇵
- API-ONLY Mode: Data retrieval exclusively through REST API
- Parameter Synchronization: Sync year/race/session settings between main and sub-windows
- Modular Design: Independent and extensible analysis modules
- Dynamic Import Architecture: Optimized memory usage with on-demand module loading
🆕 What’s New in V0.2.0
Major Features
Bug Fixes
UI/UX Improvements
Technical Improvements
📋 System Requirements
- Operating System: Windows 10 or later
🚀 Installation
- Run
F1T_GUI.exe - No Python installation required!
📖 Quick Start Guide
- Select Year/Race/Session from the main window dropdowns
- Choose Analysis Module from the menu (e.g., Throttle Analysis > Throttle Line Chart)
- Select Drivers for comparison (Driver 1 required, Driver 2 optional)
- View Analysis Results in the MDI window
- Interact with Charts: Pin tooltips, drag legend, zoom/pan
Example: Throttle Line Chart Analysis
1. Menu: Throttle Analysis > Throttle Line Chart
2. Set: Year=2025, Race=Japan, Session=R
3. Select: Driver 1 = VER, Driver 2 = LEC (or None)
4. View: Per-lap throttle usage comparison
5. Interact: Click to pin tooltips, drag to reposition
📝 Version History
Current Version: V0.3.0 (2025-10-10)
Major Features:
- ✅ Ideal Lap Ranking Analysis: Comprehensive theoretical best lap comparison for all drivers
- ✅ Ideal Lap Sector Comparison: Detailed sector-by-sector performance analysis with cumulative delta visualization
- ✅ Interactive Lap Analysis Tree: Hierarchical lap data view with smart filtering and click-to-analyze functionality
- ✅ Box Plot Typography Standardization: Unified 8pt font across all chart elements for consistency
UI Refinements:
- 🎨 Sector marks with mixed color display (green ✓ for optimal, black ✗ for improvable)
- 🎨 Unified color standards for gap displays (0.2s, 0.5s thresholds)
- 🎨 Sortable cumulative delta column in sector comparison table
- 🎨 Team color coding with black text for better readability
Technical Improvements:
- Custom
SectorMarksDelegatefor per-character color rendering - Shared color configuration module for visual consistency
- Enhanced sorting functionality with dual DisplayRole/UserRole data
- API-first data loading architecture
Previous Version: V0.2.1 (2025-10-09)
- Colour palette system gains API-only mode toggle
- Refreshed 2025 team/driver colours with API fallback hardening
- Lap/Throttle box plots now render median & outliers in black
- Main window and packaging metadata bumped to V0.2.1
Previous Version: V0.2.0 (2025-10-08)
- Added Throttle Analysis Module (Line Chart + Box Plot)
- Enhanced tooltip system with drag support
- Improved dual-driver comparison
- Multiple bug fixes and UI improvements
Legacy Version: V0.1.0
- Initial release with core analysis modules
- Basic telemetry analysis
- MDI workspace system
👥 Contributing
Contributions are welcome! Please feel free to submit pull requests or open issues for bugs and feature requests.
Development Guidelines
- Follow the existing code structure
- Update
hiddenimportsinF1T_GUI.specfor new dynamic imports - Test both Python and EXE environments
- Update documentation for new features
📄 License
This project is licensed under the MIT License - see the LICENSE file for details.
🙏 Acknowledgments
📧 Contact
- GitHub: WarmBed/F1-TelemetryStation-Pro
- Issues: Report a Bug
- Discussions: Join the Discussion
📸 Screenshots
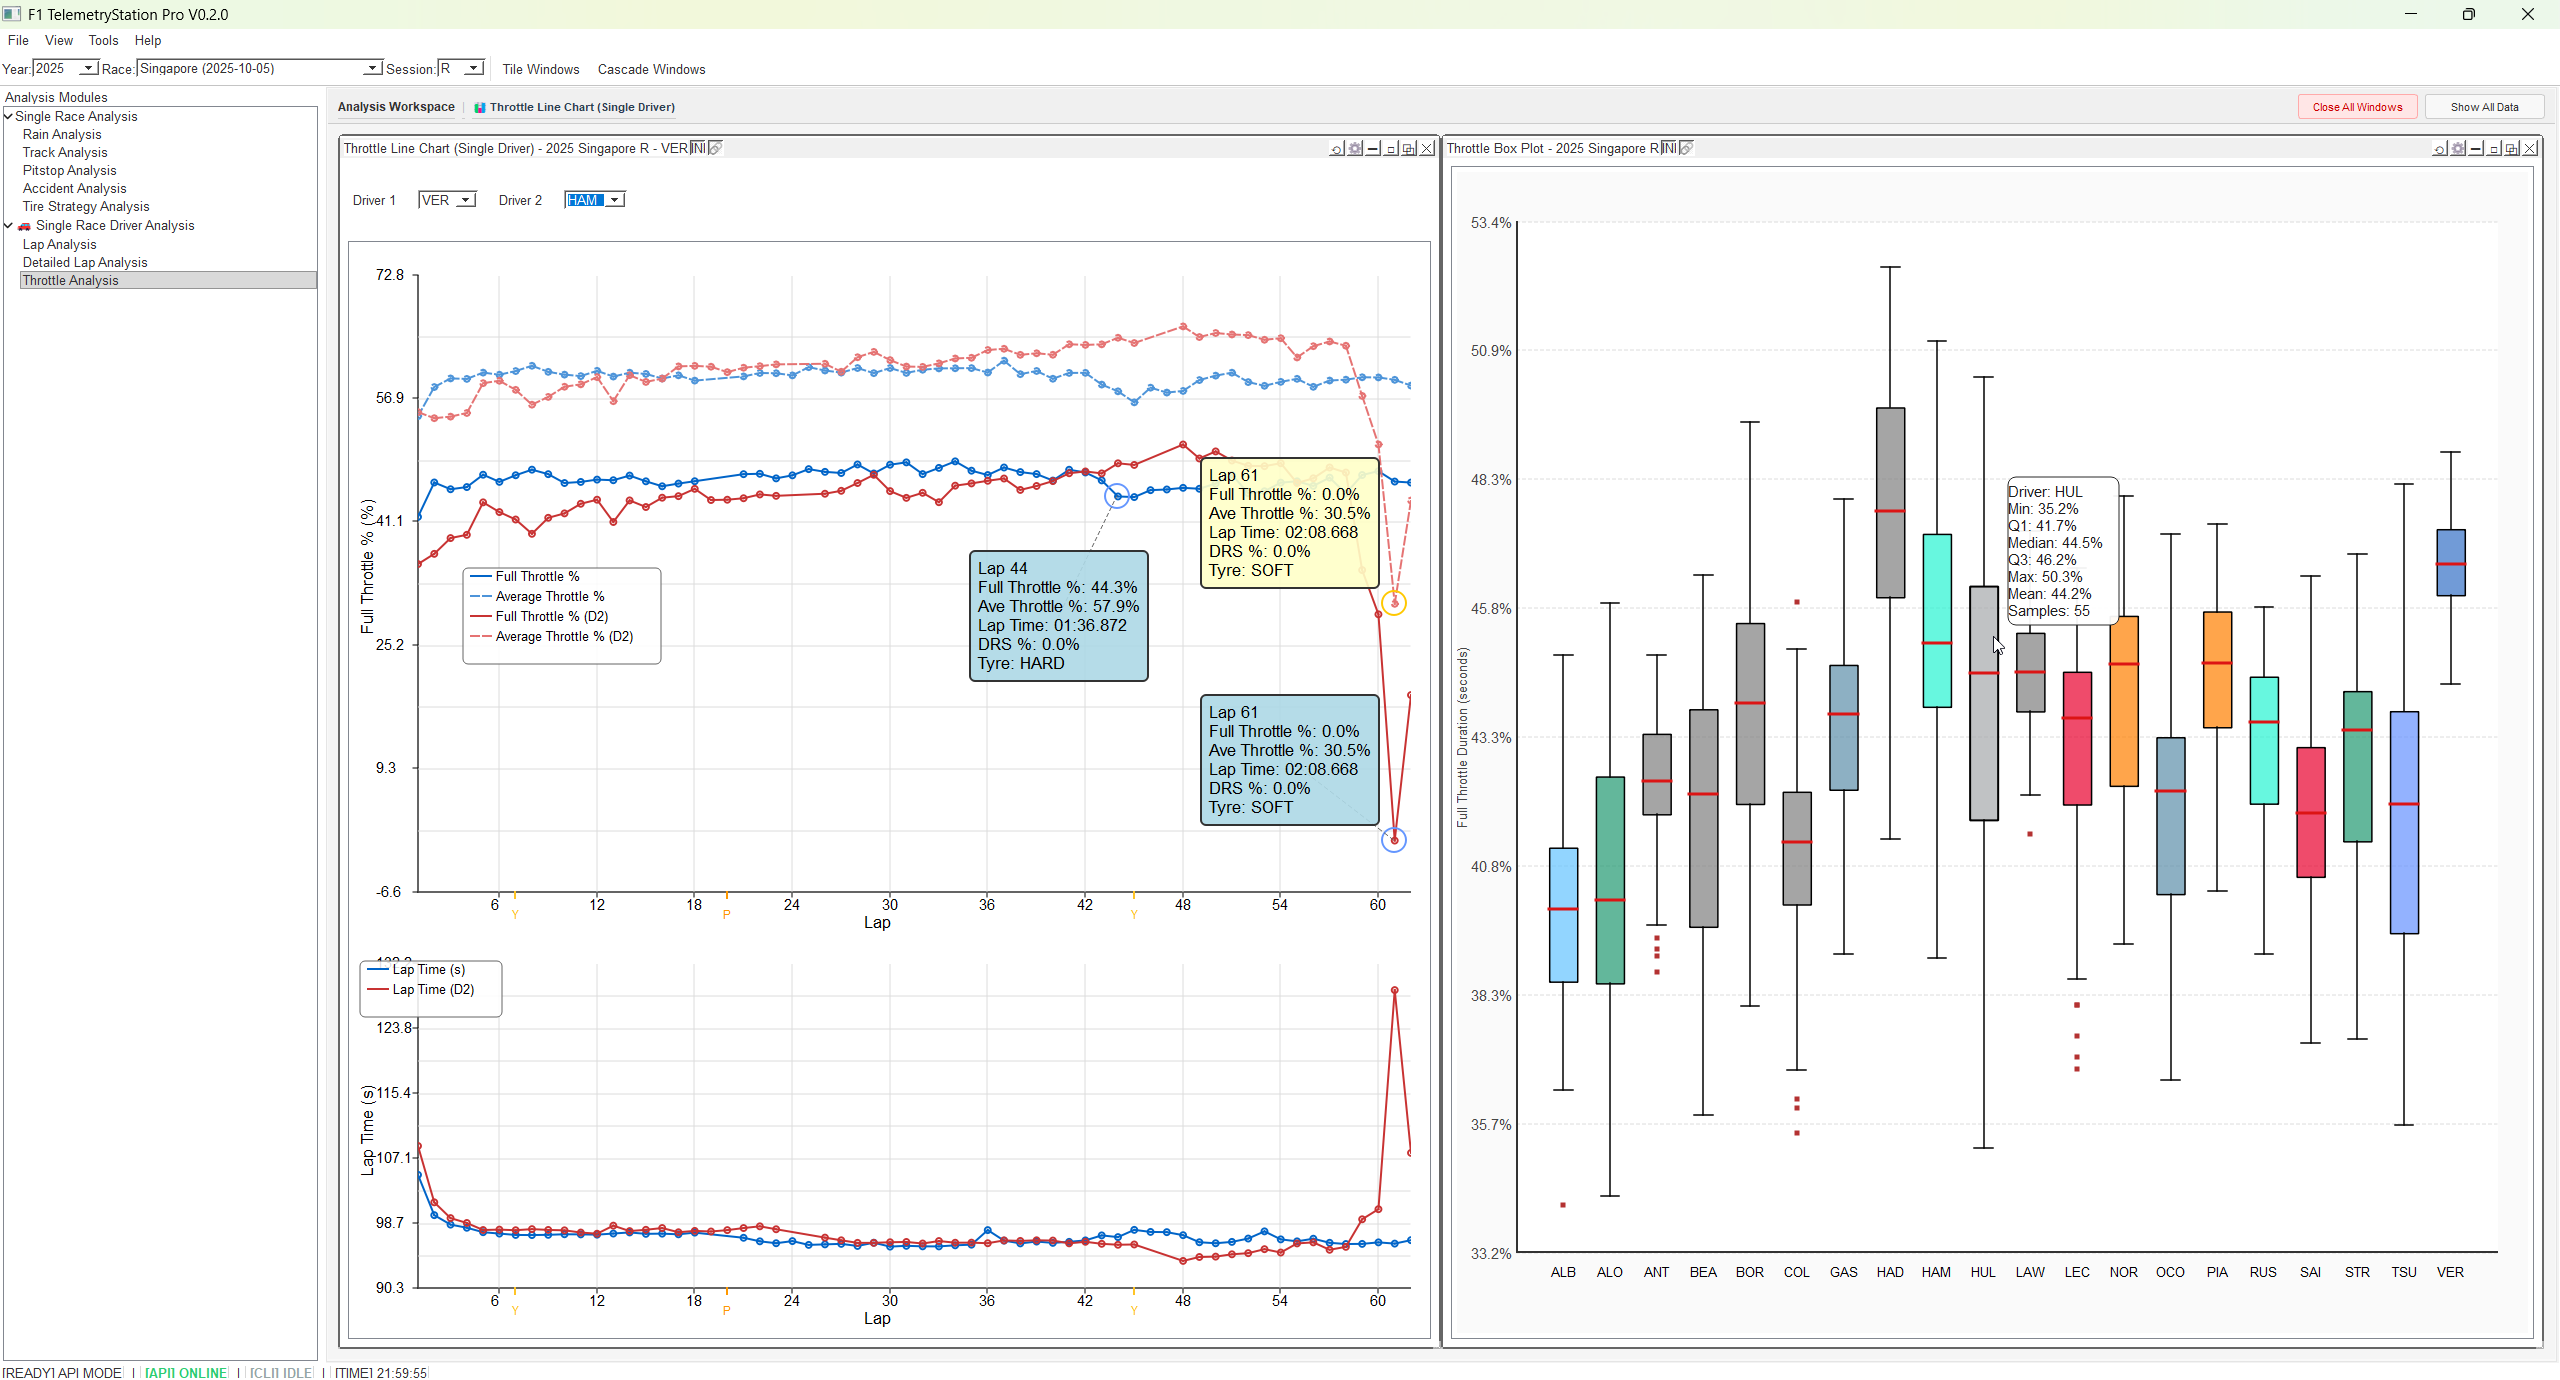
Throttle Line Chart (V0.2.0)
Per-lap throttle usage comparison with dual-driver support
Throttle Box Plot (V0.2.0)
Statistical distribution of throttle usage across all drivers
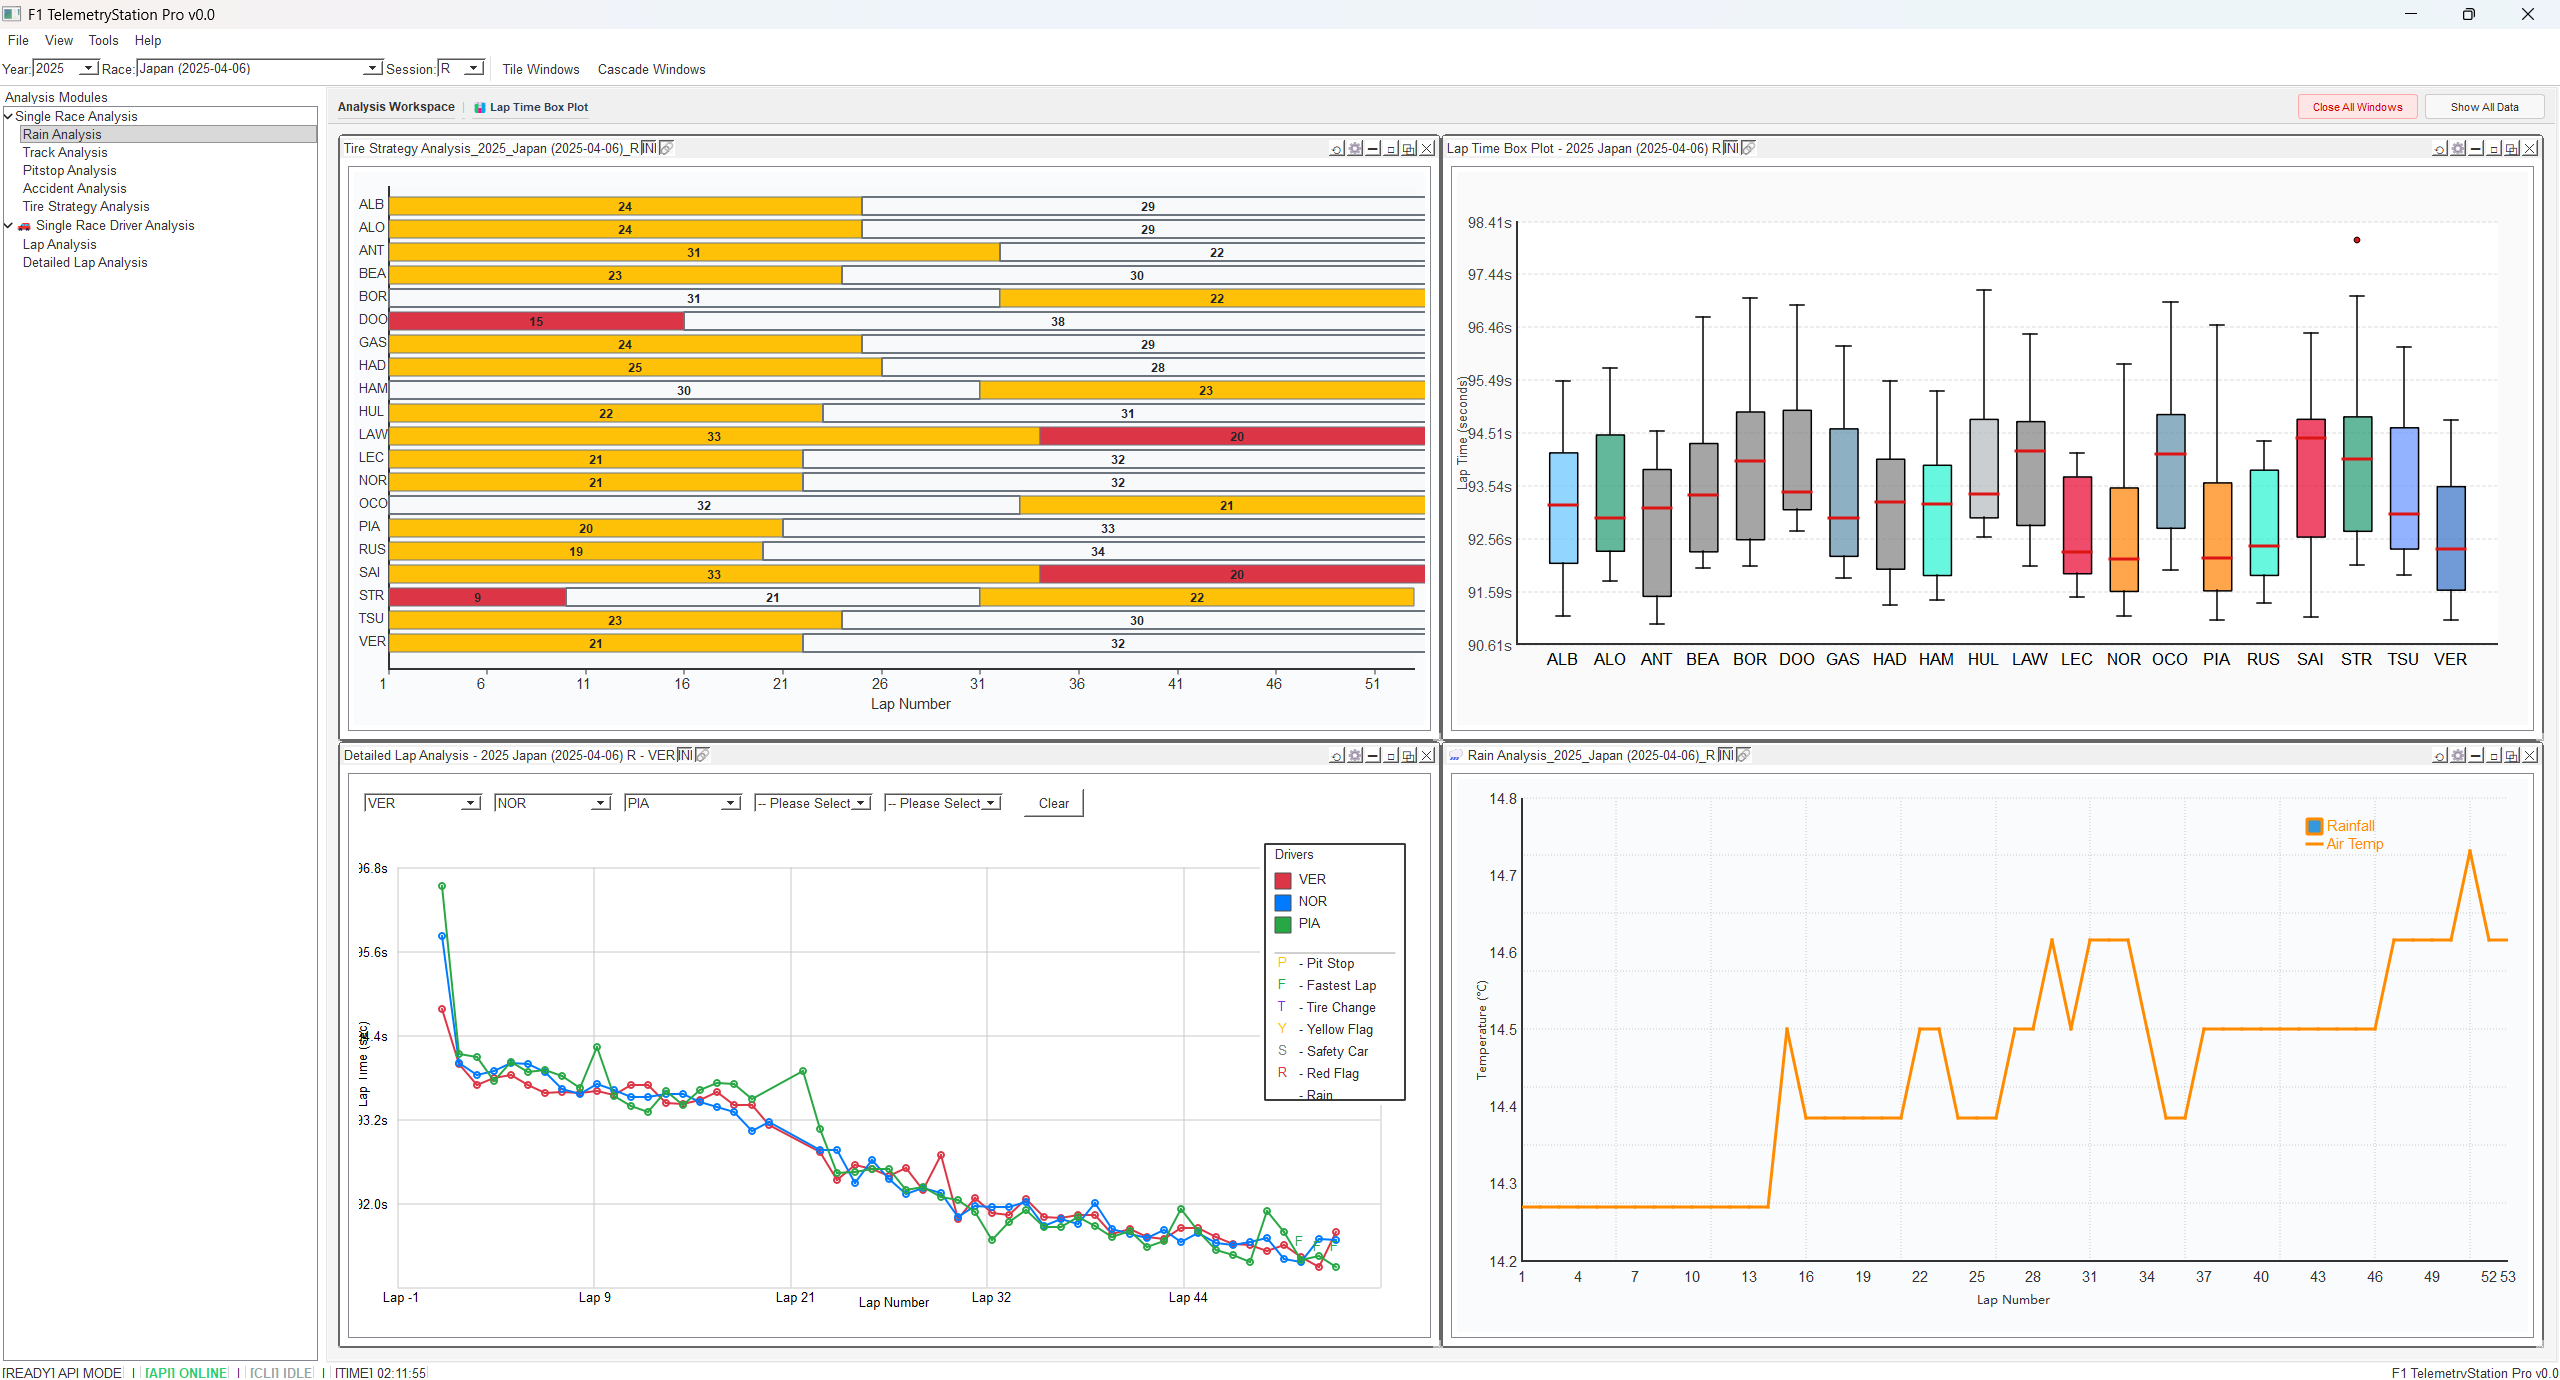
Detailed Lap Analysis
Comprehensive lap time analysis with box plot visualization
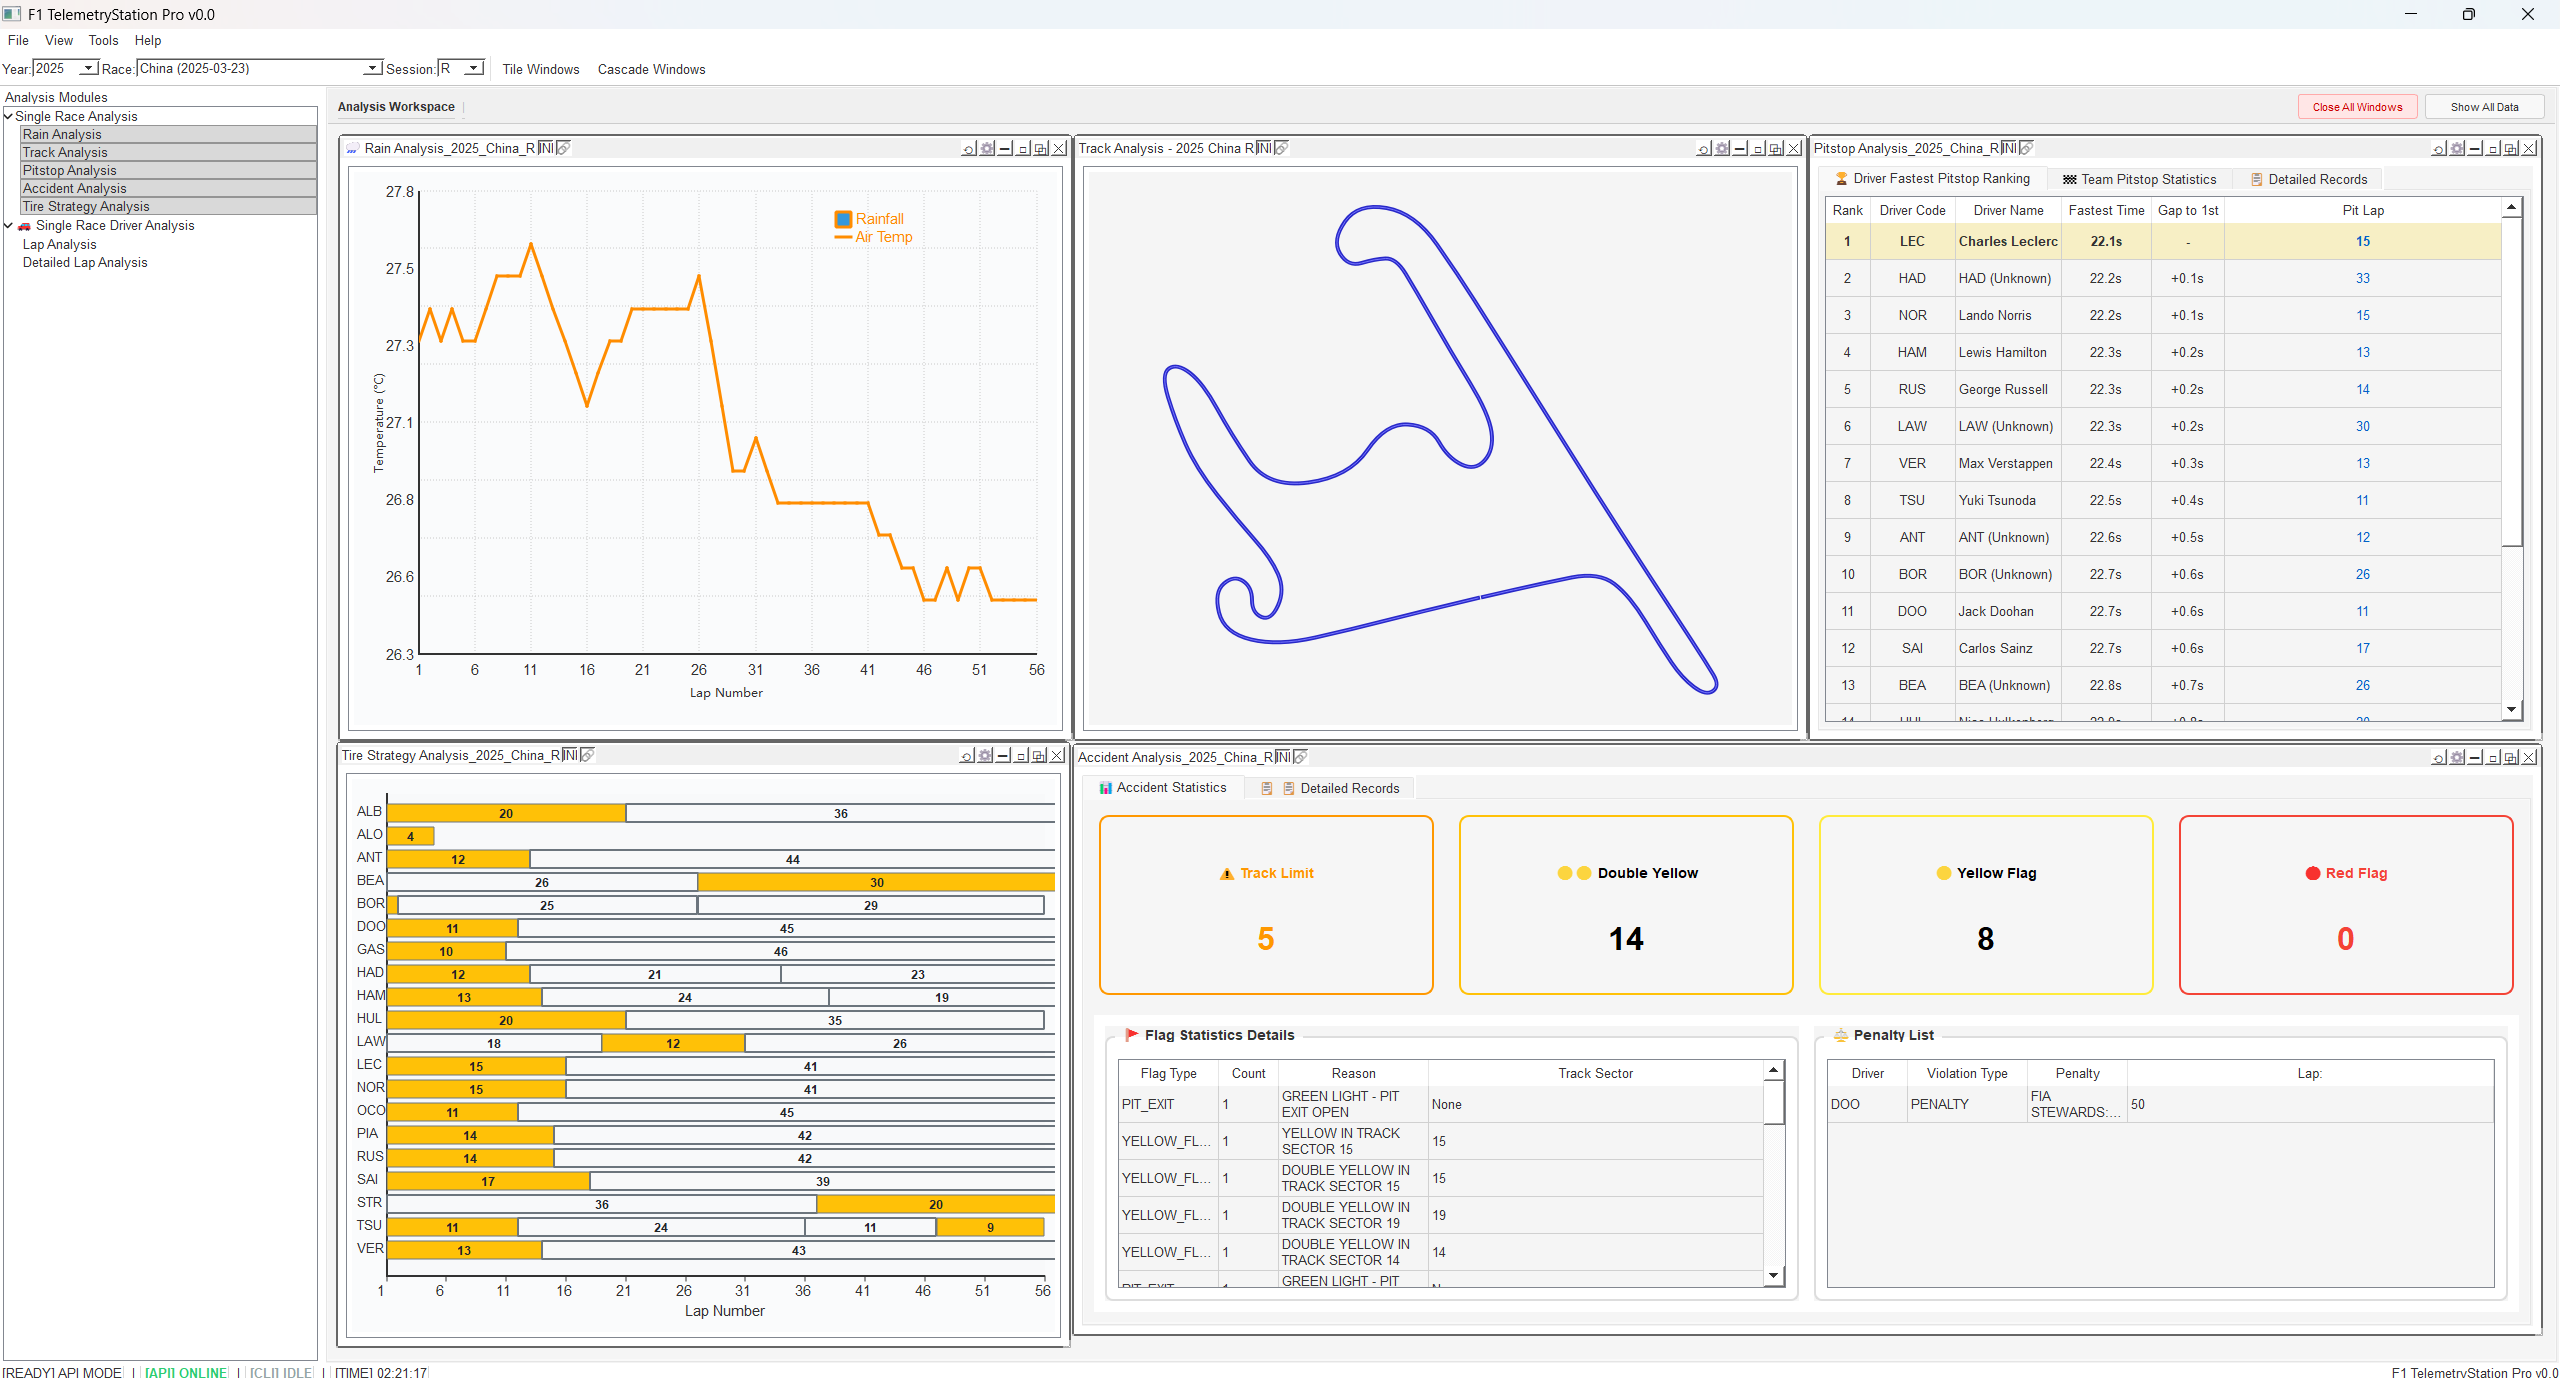
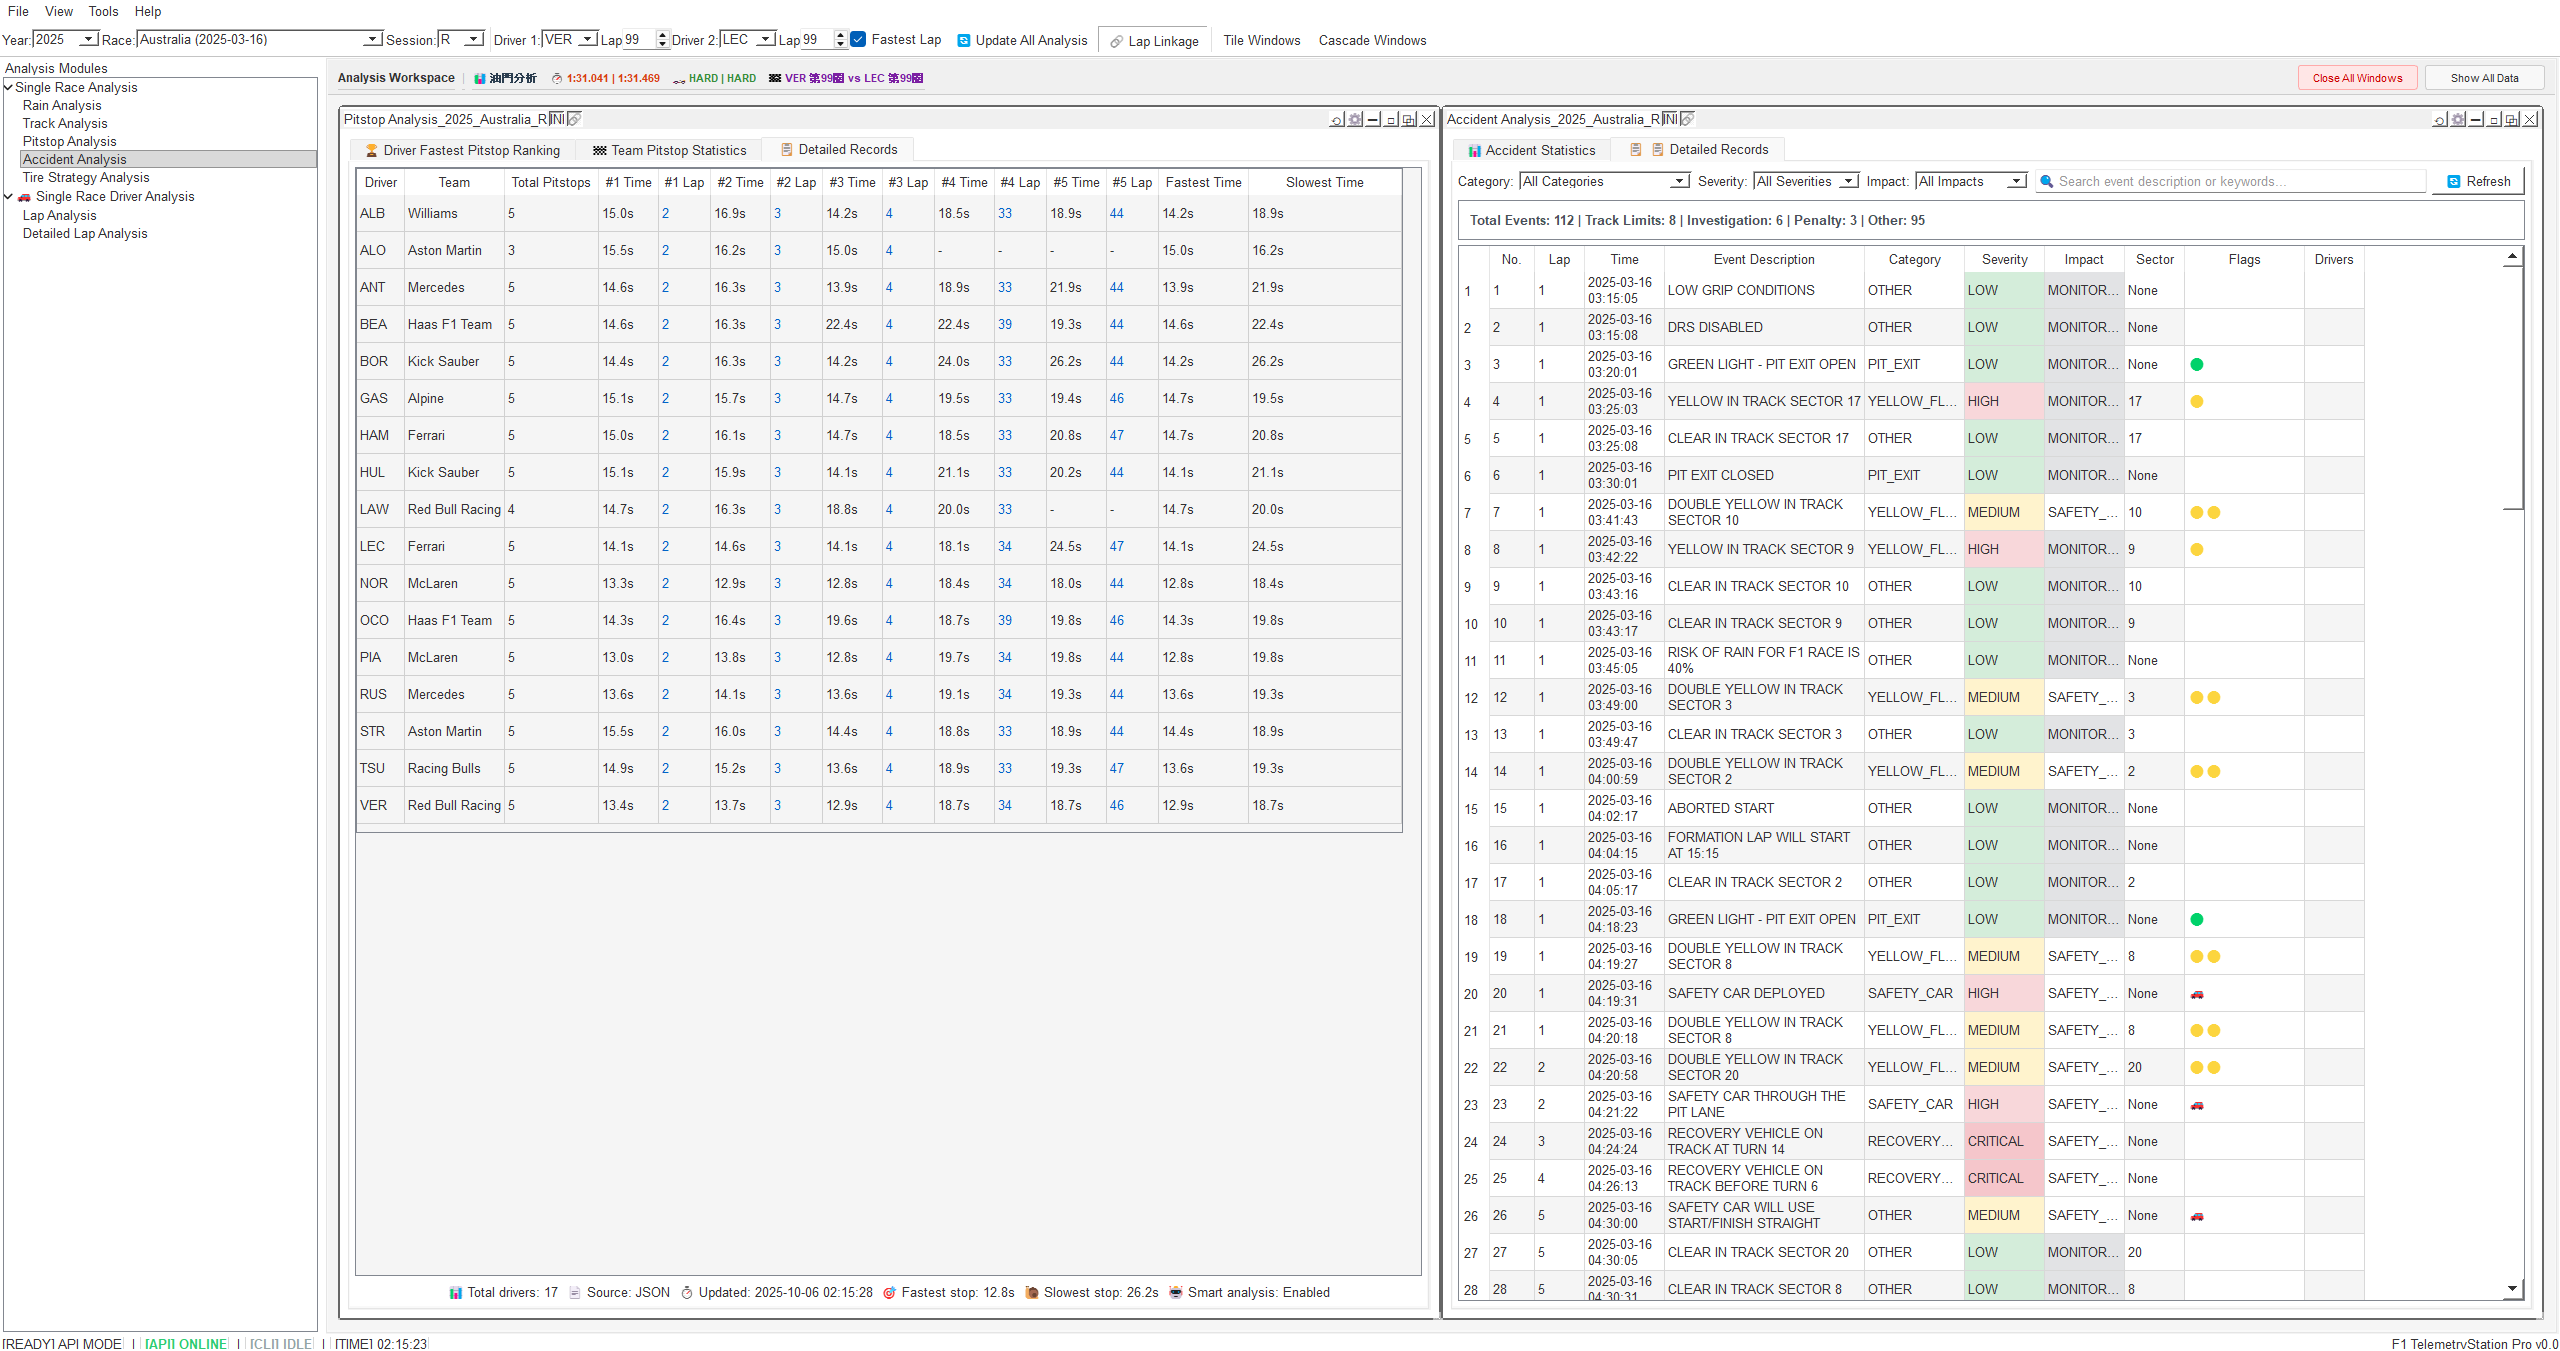
Multi-window MDI Workspace
Flexible workspace with multiple analysis views
Made with ❤️ for F1 enthusiasts and data analysts
Star ⭐ this repository if you find it useful!